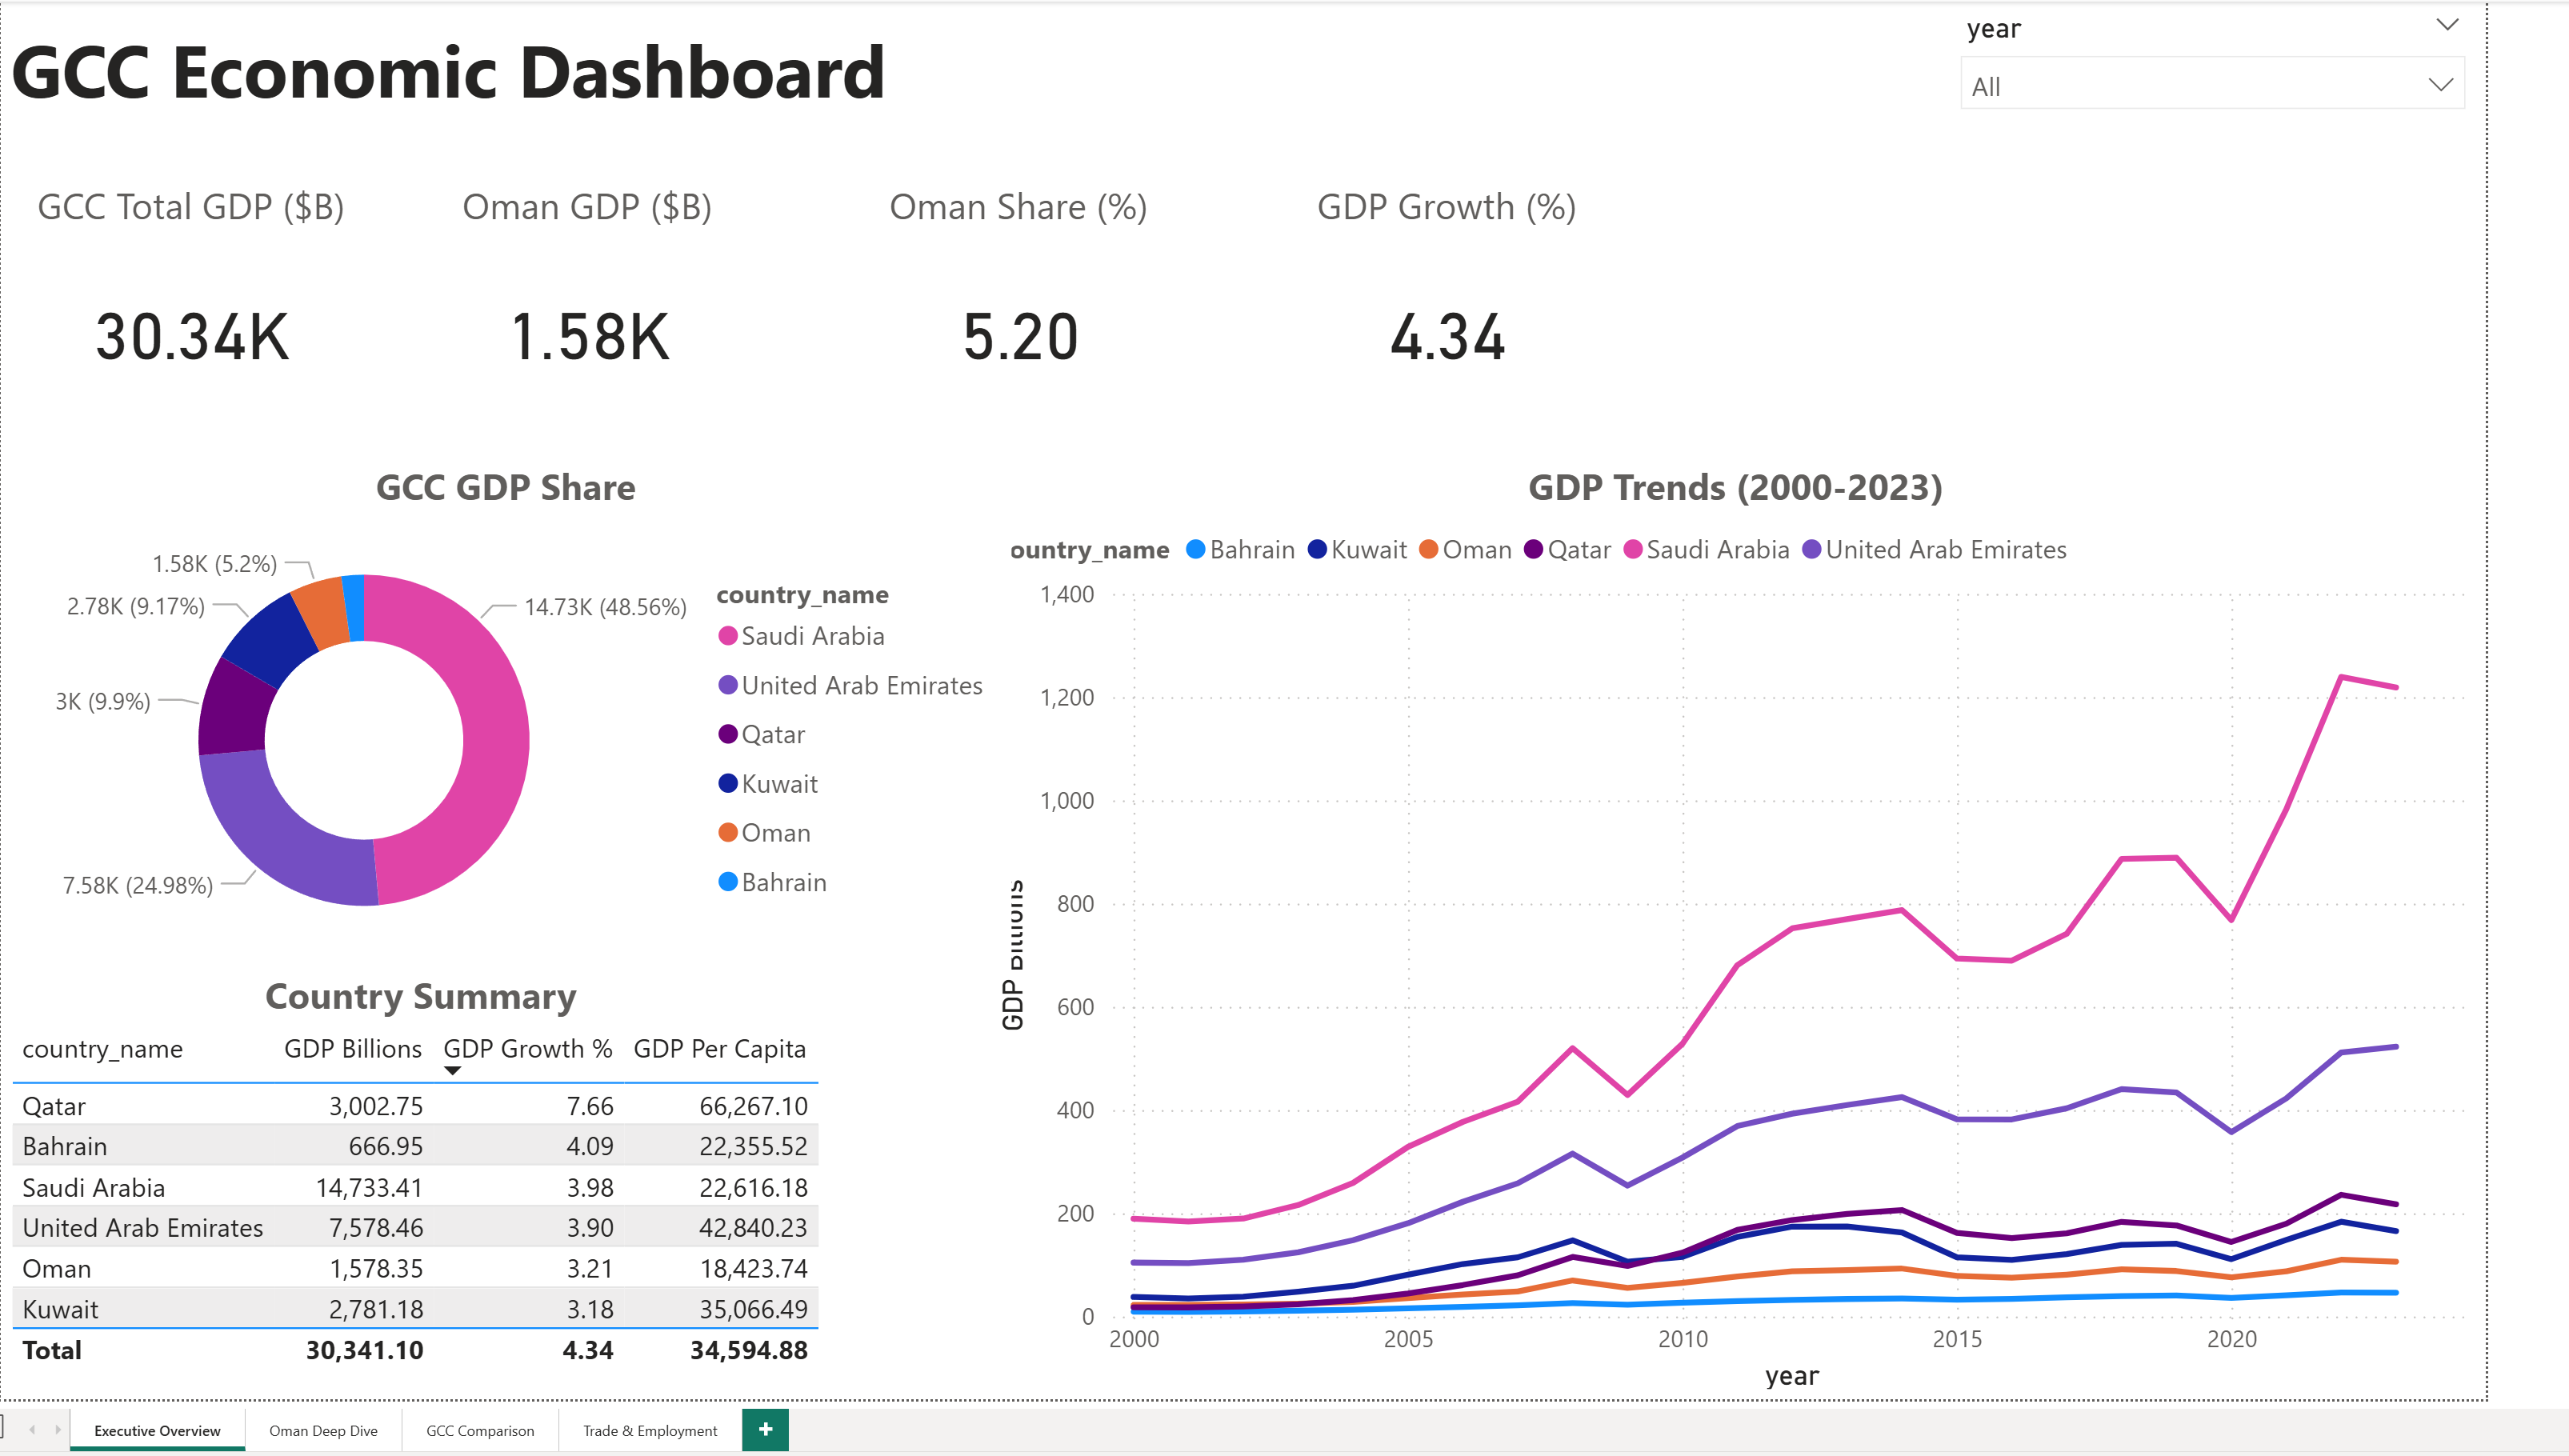
GCC Economic Dashboard
Interactive Power BI analysis of Gulf economies
The Problem
Economic data for GCC countries is scattered across multiple sources, making comparative analysis difficult for researchers and analysts.
What I Built
Built a 4-page interactive Power BI dashboard with star schema data model, 30+ DAX measures, and cross-filtering capabilities for comprehensive GCC economic analysis.
My Role
Designed and built the complete dashboard including data model, DAX measures, and interactive visualizations.
See It In Action
Executive Overview Dashboard
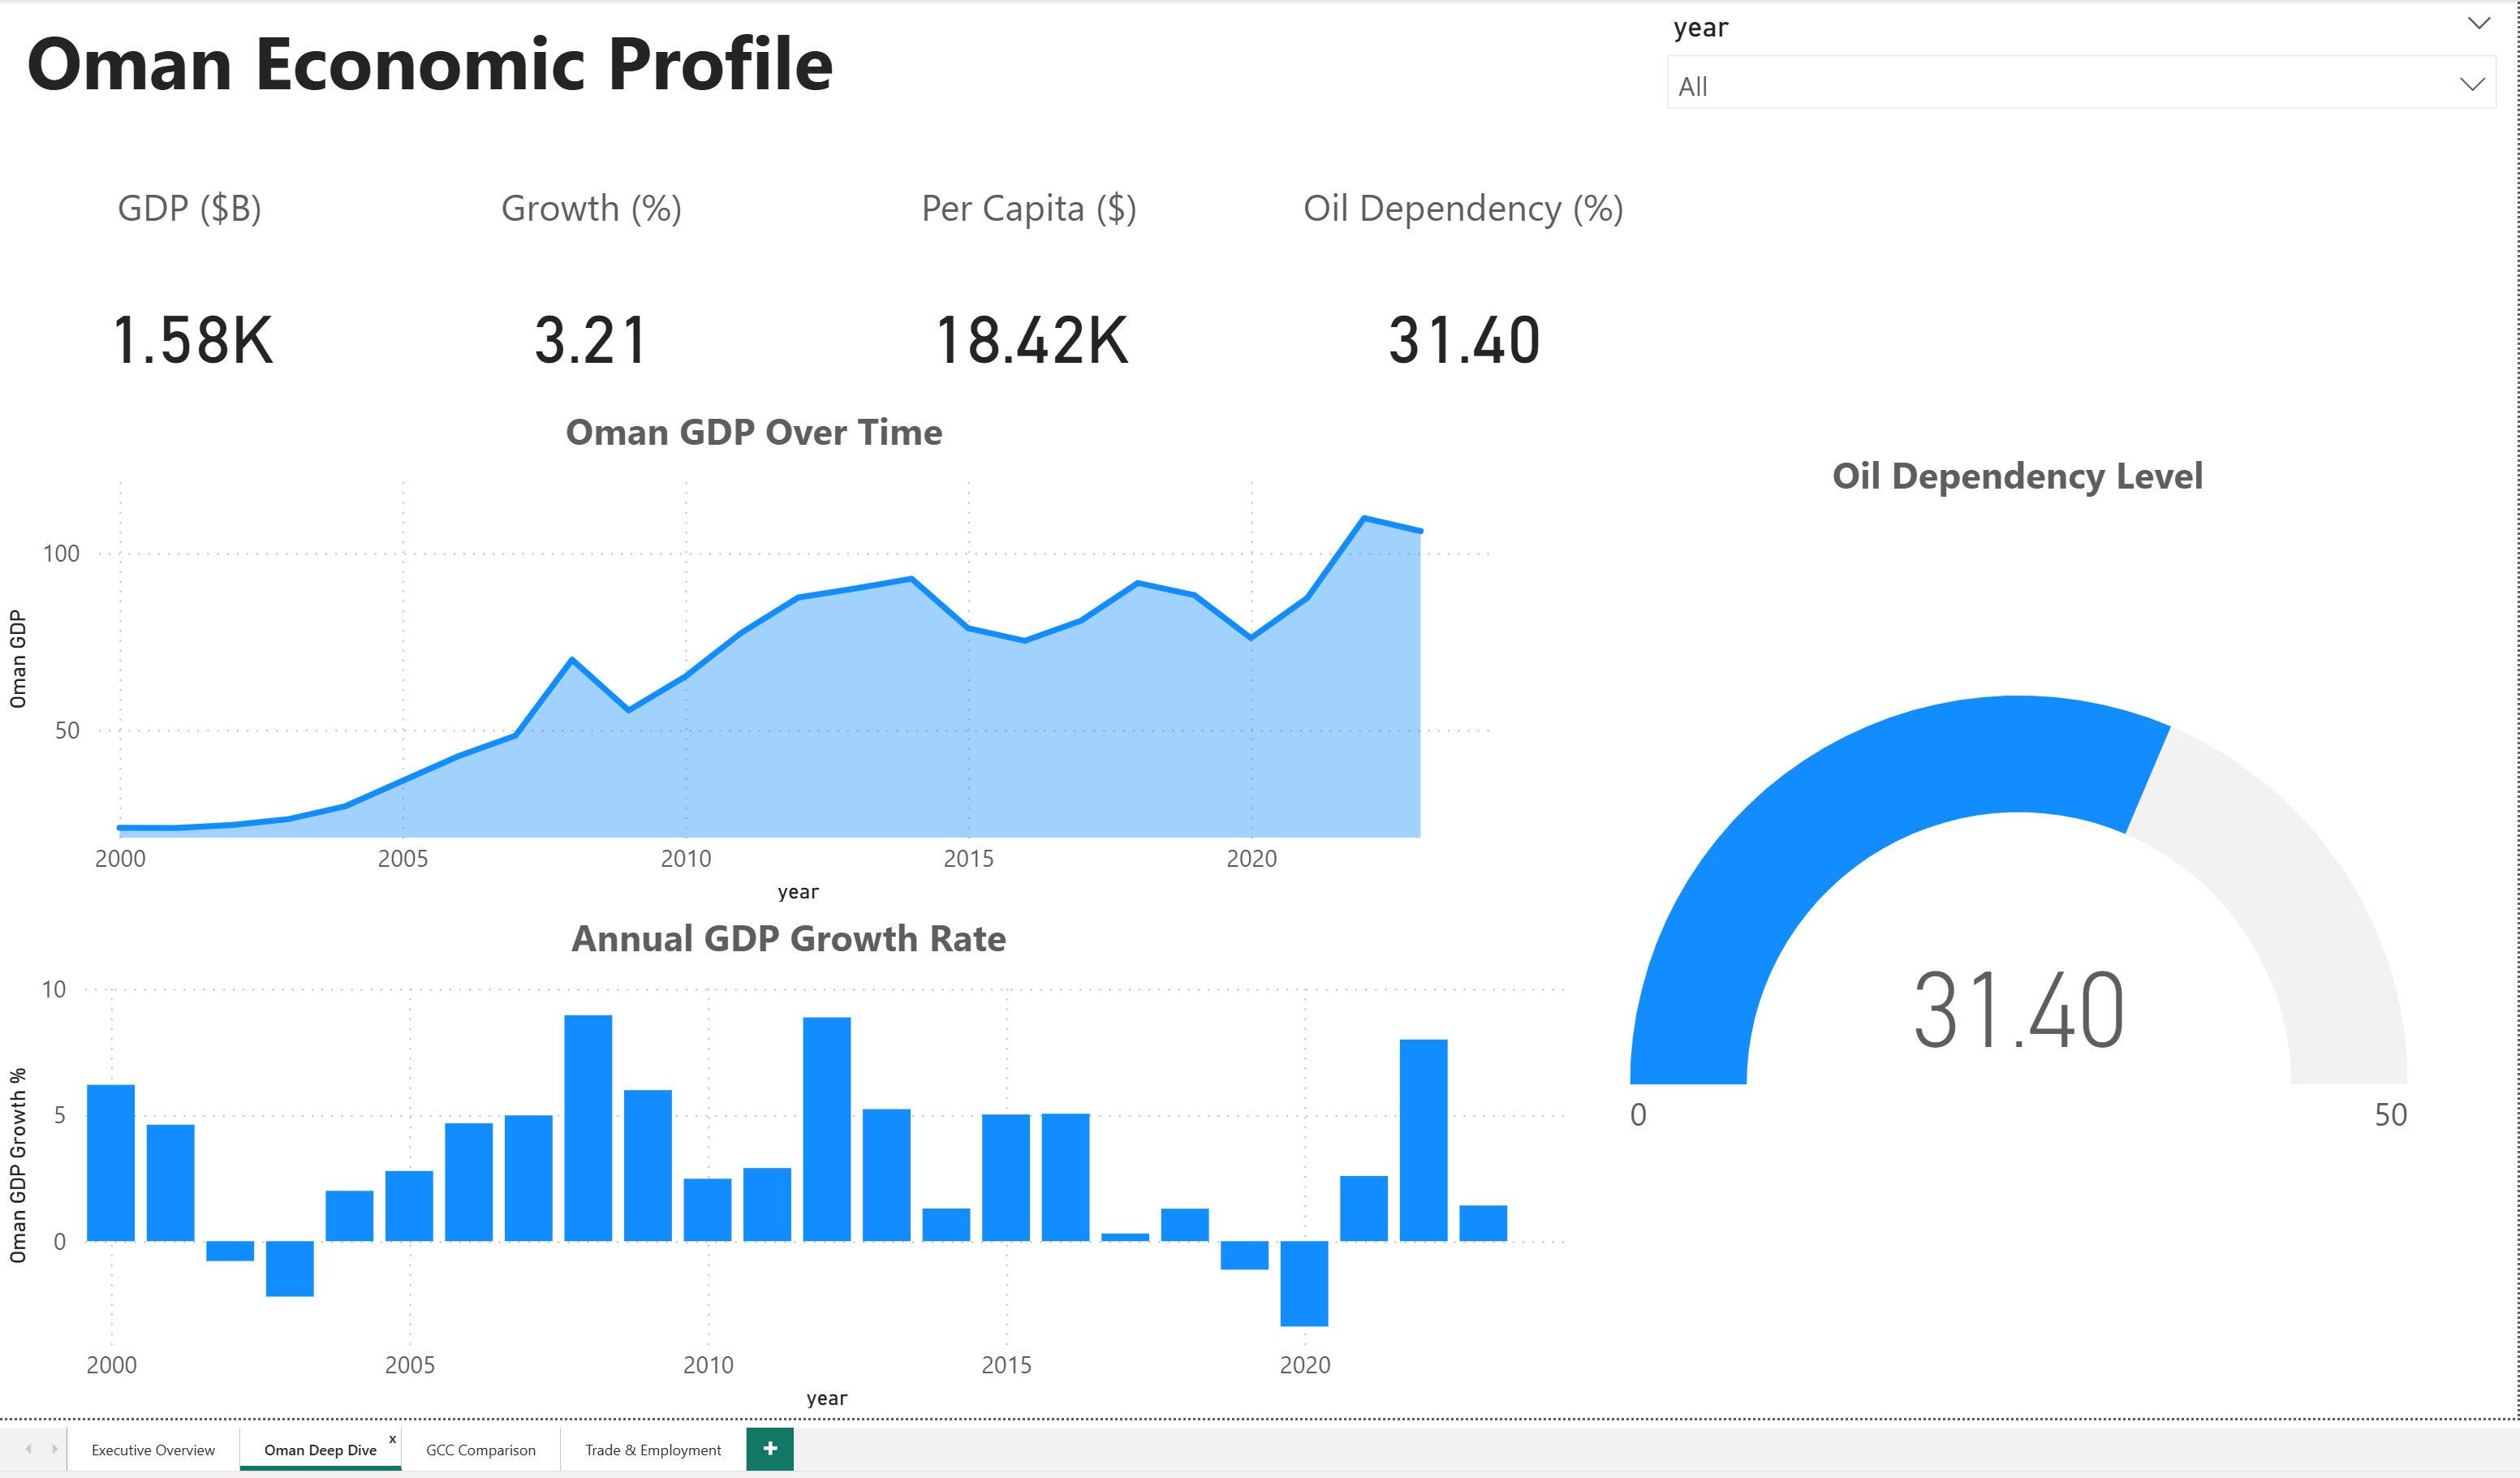
Oman Economic Deep Dive
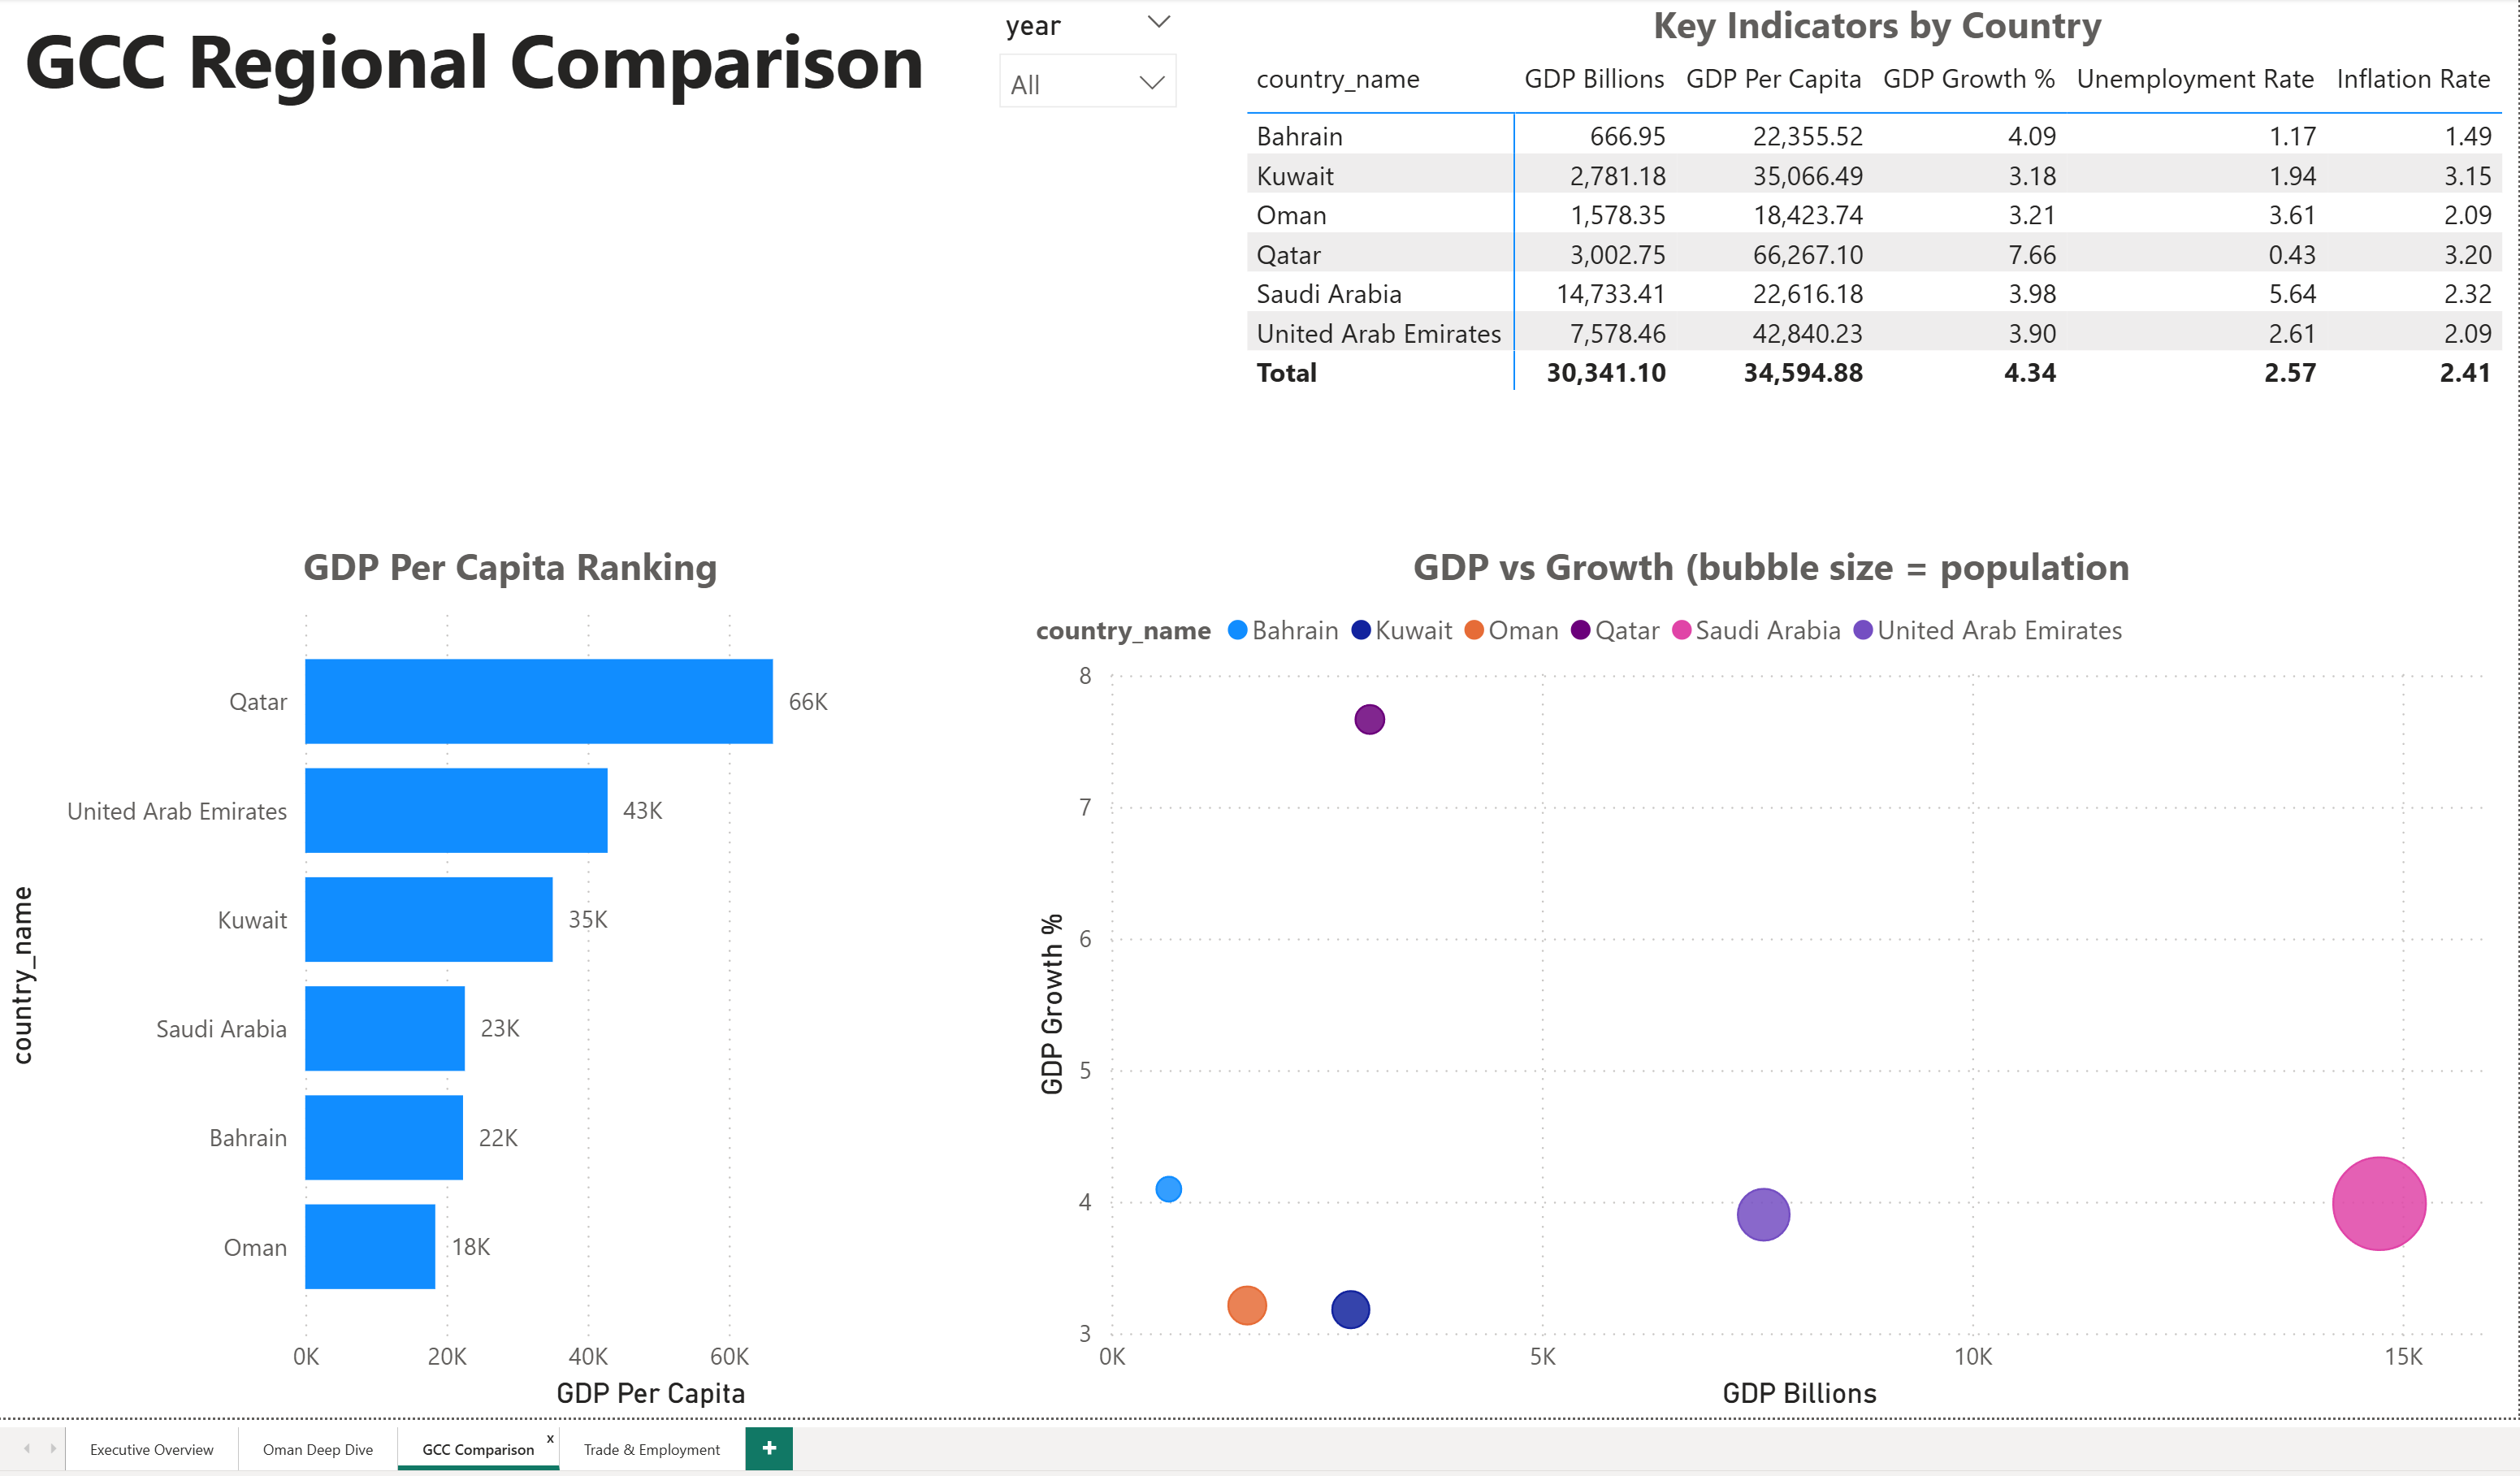
GCC Countries Comparison
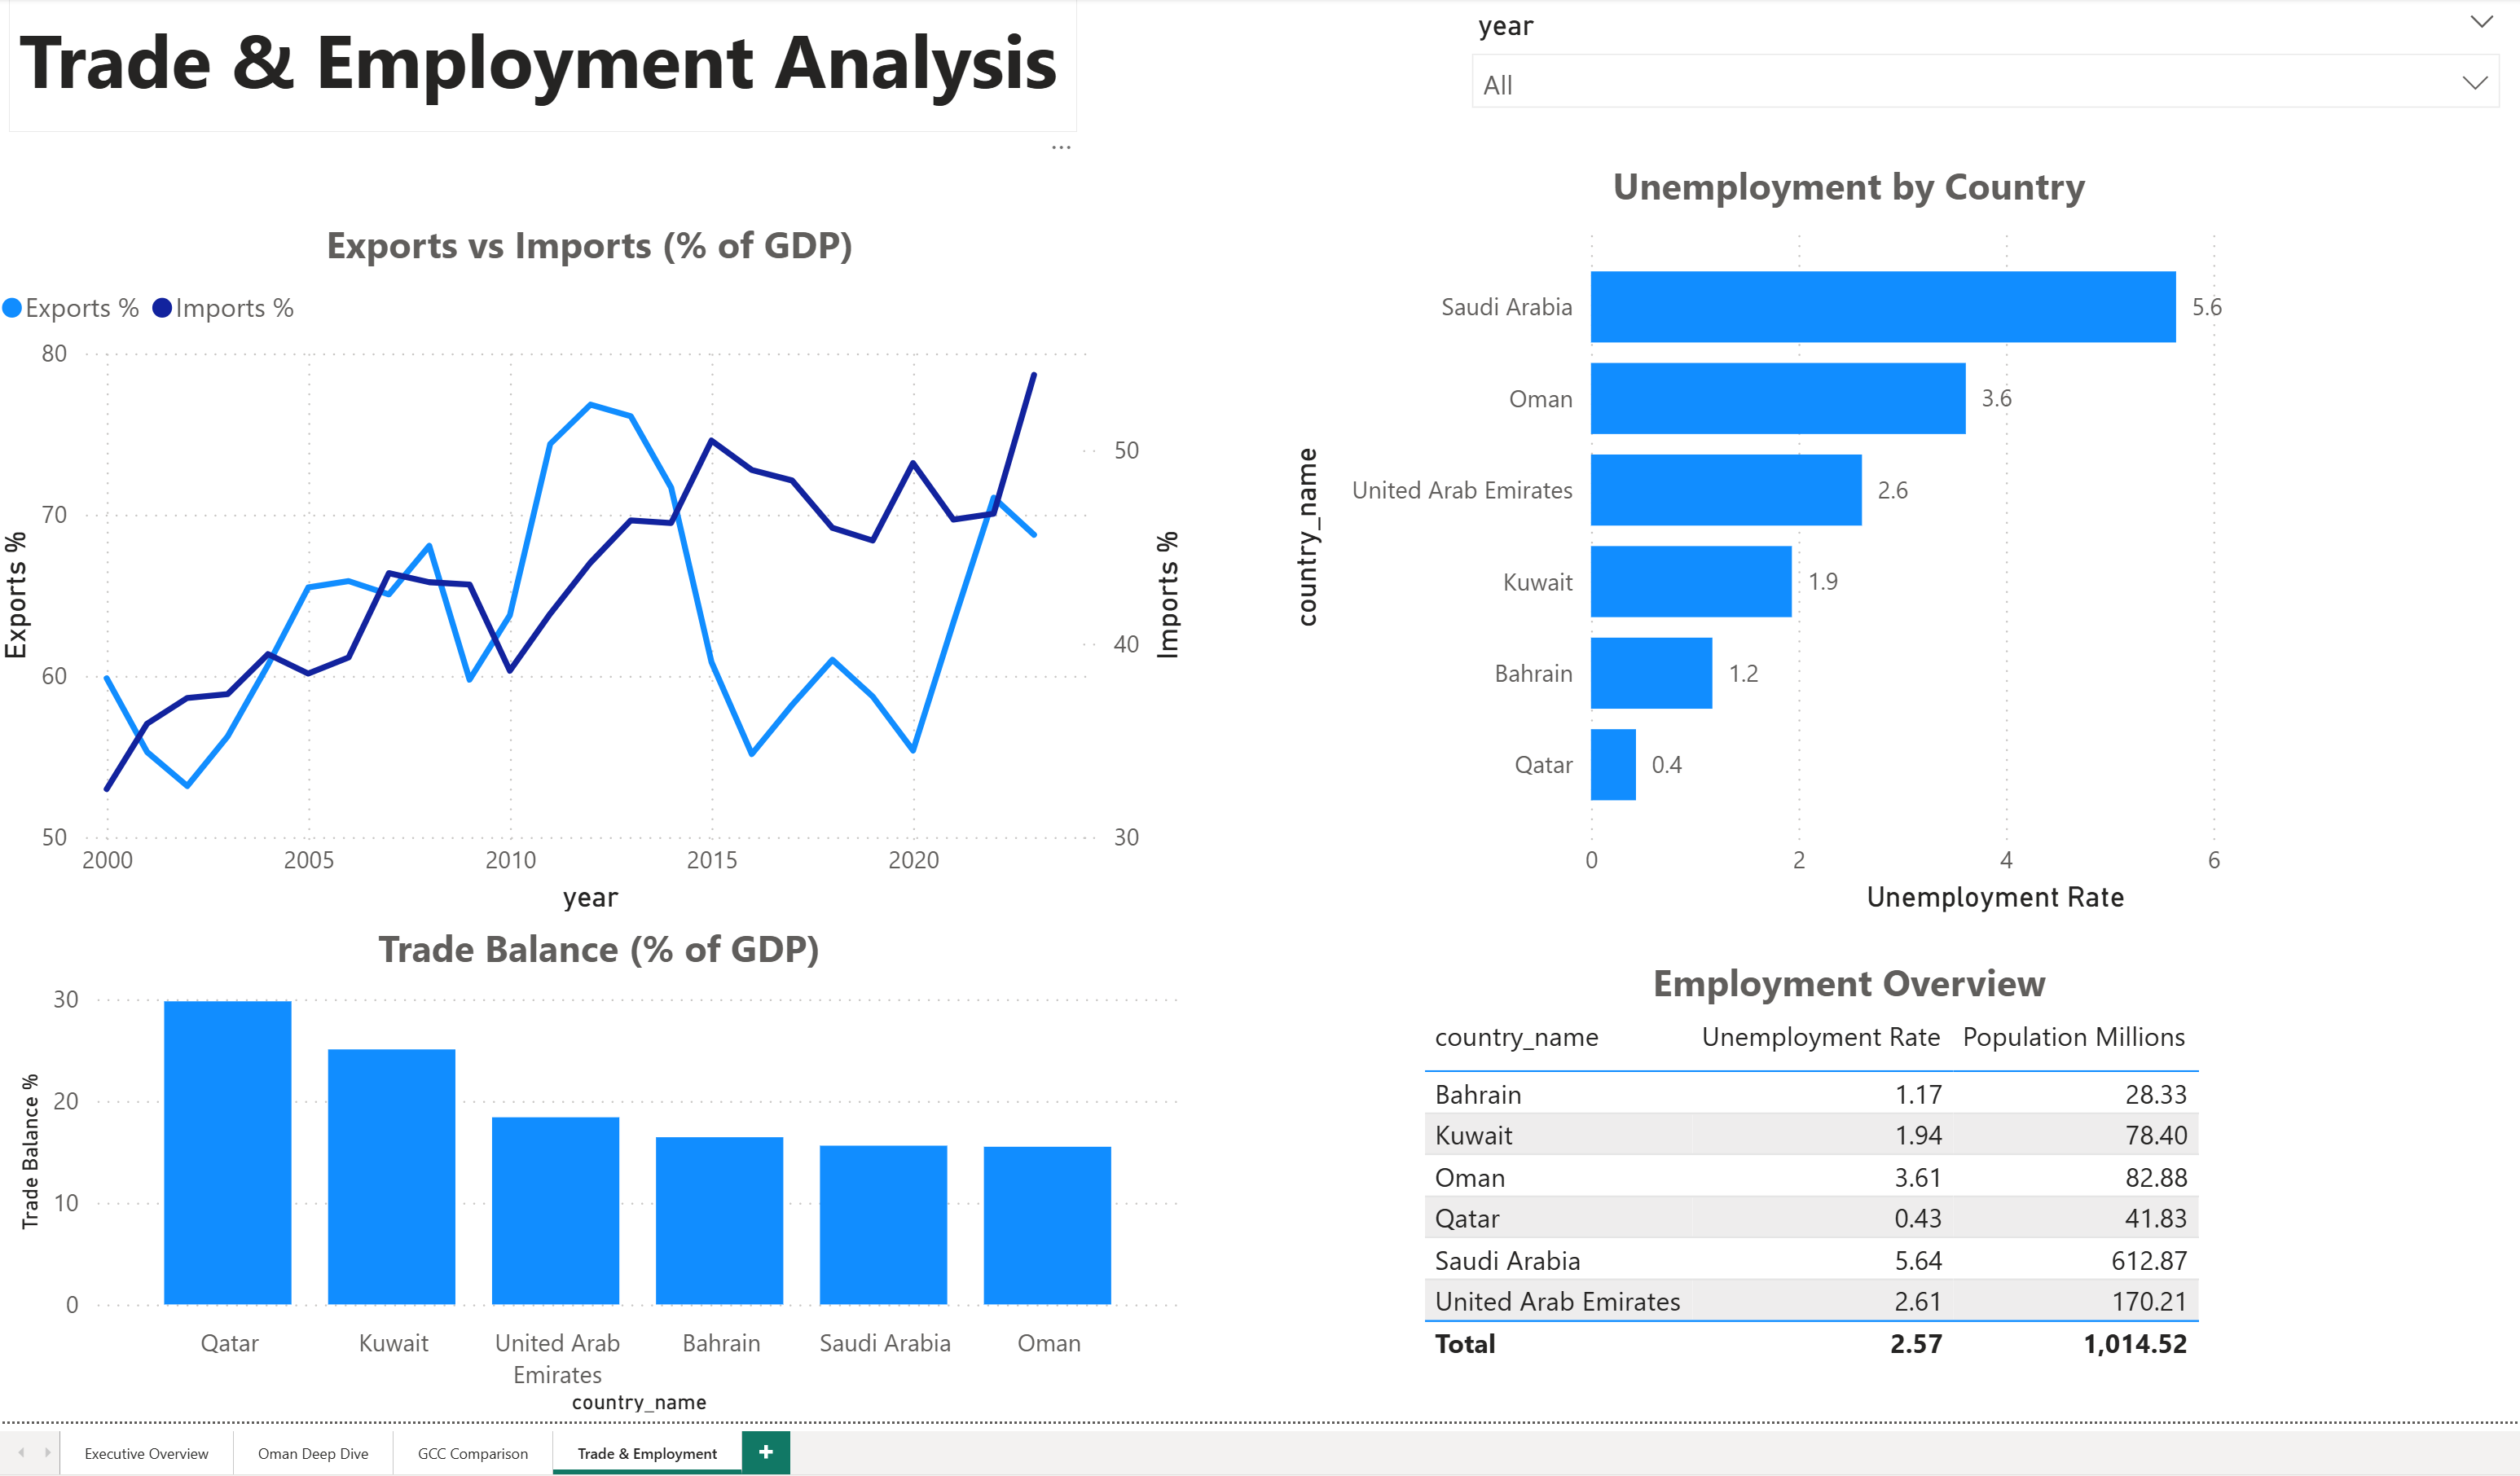
Trade & Employment Analysis
How It Works
Star schema with fact and dimension tables
DAX measures for GDP, growth rates, YoY changes
Cross-filtering between all visualizations
Custom theme with GCC country colors
Mobile-responsive layout
Key Takeaways
Data modeling determines dashboard performance
Consistent color coding improves readability
Drill-through enhances analytical depth